
Monitoring a Linux system is usual for every user. Especially if you are a system admin, you might need to check your system elaborately. You can’t find many tools to know the system’s overall status; finding an application that can generate a real-time in-depth system status is complicated. The Perf is one of the Linux tools you can use to know the detailed health checkup and the live position on your system. Perf is one of the most used and robust system monitoring tools to gather information on the Linux kernel, CPU, and hardware. Moreover, it can also perform dynamic tracing, checking hardware status, and provide benchmark reports on a Linux machine.
Perf Monitoring Tool in Linux
On Linux, the Perf tool can analyze kernel, applications, system libraries, software events through commands and subcommands. It can also be used as a PMU (performance monitoring unit) on Linux. The Perf tool is written in the C programming language and built under the GNU GL license. In this post, we will see how to install the Perf tool on a Linux system and how to run it.
1. Install Perf in Ubuntu/Debian Linux
The Perf system monitoring and the analyzing tool come with the Linux-common packages. Installing Perf on Ubuntu or Debian Linux distributions is pretty easy and straightforward. First, you may start with updating your system repository.
sudo apt update
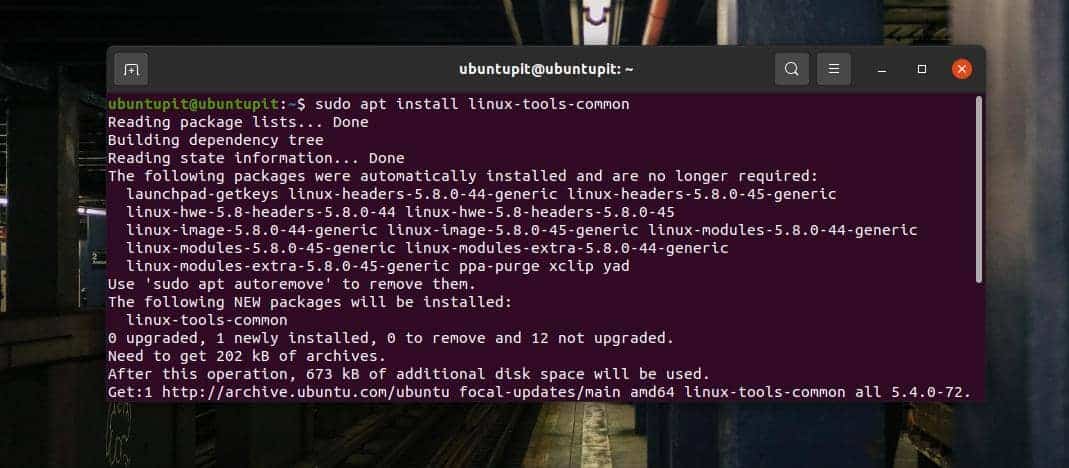
Then, run the following aptitude command given below to install the Linux common tools on your machine. The following command requires root privilege; make sure you are the root user. When the installation finishes, you may find the Perf packages inside the /usr/bin/perf directory.
sudo apt install linux-tools-common
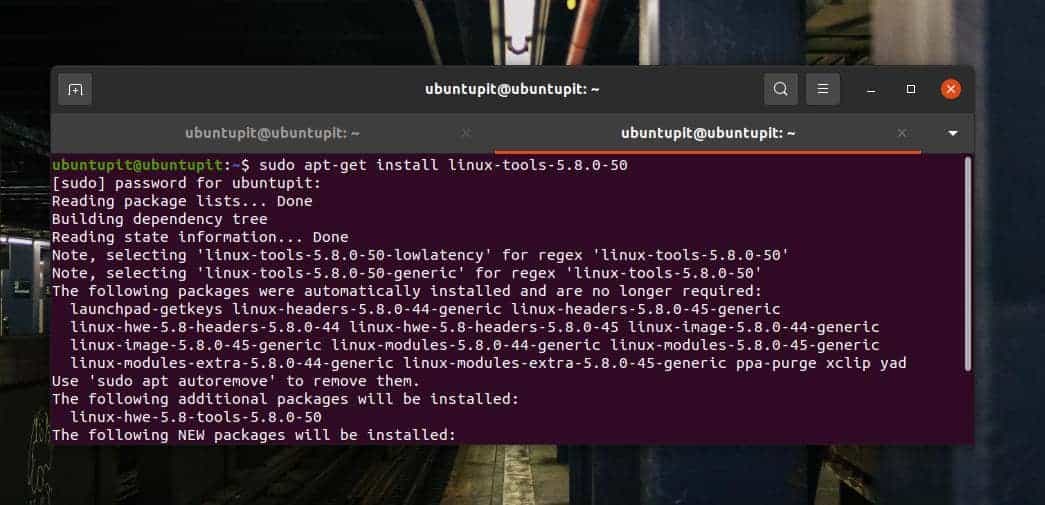
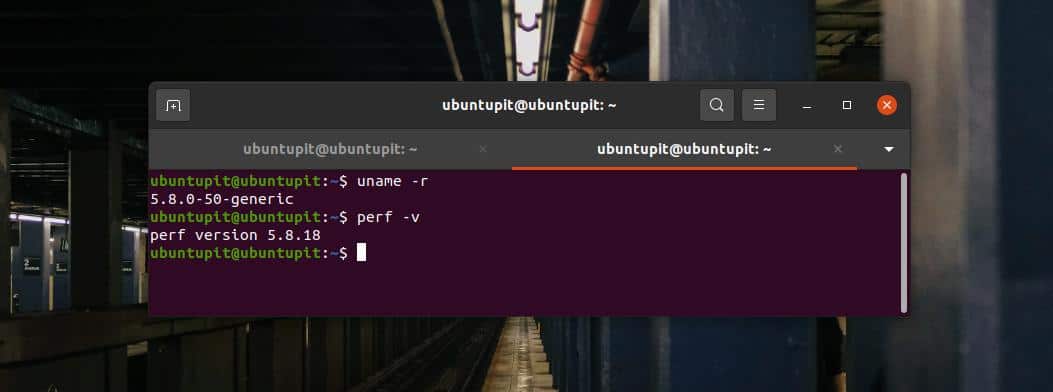
As the Perf is a Linux-common package, make sure that Perf is compatible with your Linux kernel. To check the kernel of your system, run the following command. In return, you will get the version of your kernel.
uname -r
Now, note down your kernel version, and write a terminal command shown below to install Linux-common tools that suit your kernel.
sudo apt-get install linux-tools-5.8.0-50
You can now finally run the following command to check the version of Perf on your machine. In return, you would see that the Perf has the same version as the Kernel has.
perf -v
2. Installing Perf on Fedora/Red Hat
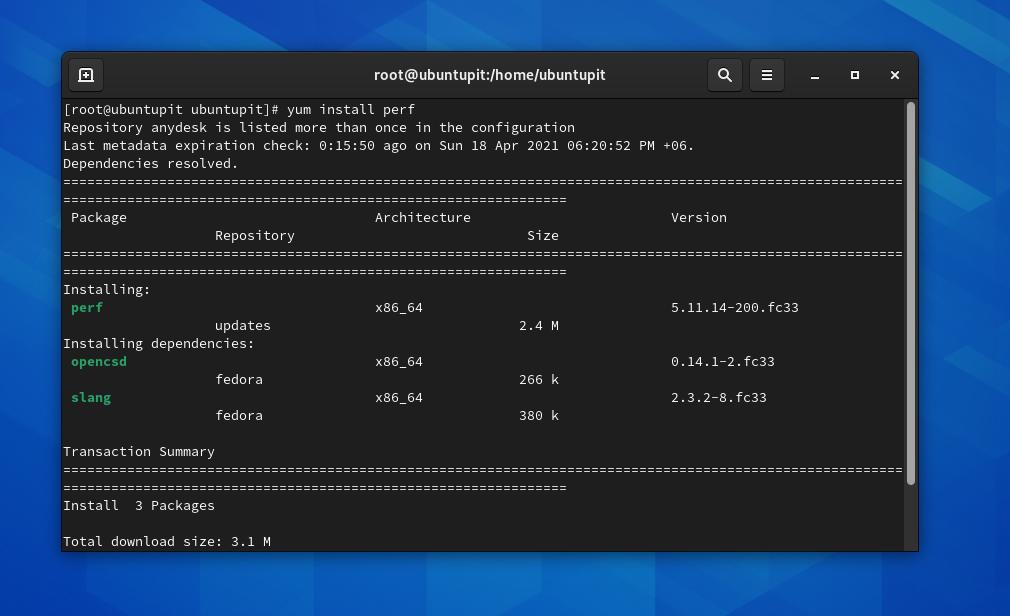
Installing the Perf system monitoring tool on a Red Hat Linux or a Fedora workstation is easier than installing it on Debian/Ubuntu. You can run the following YUM commands on your terminal shell on your machine install Perf tool. The following commands require root privilege; ensure you have it.
yum update
yum install perf
If you are using a DNF-based Red Hat machine, you can try running the following commands on the shell-install Perf.
dnf update
dnf install perf
When the installation finishes, don’t forget to run a version-check command to know if the tool is working or not.
perf -v
3. Get Started with Perf
Till now, we have seen how to install Perf on Ubuntu and the Red Hat/Fedora system. It’s time to get started with it. In the beginning, you can run a help command to get introduced with the Perf syntaxes.
perf --help
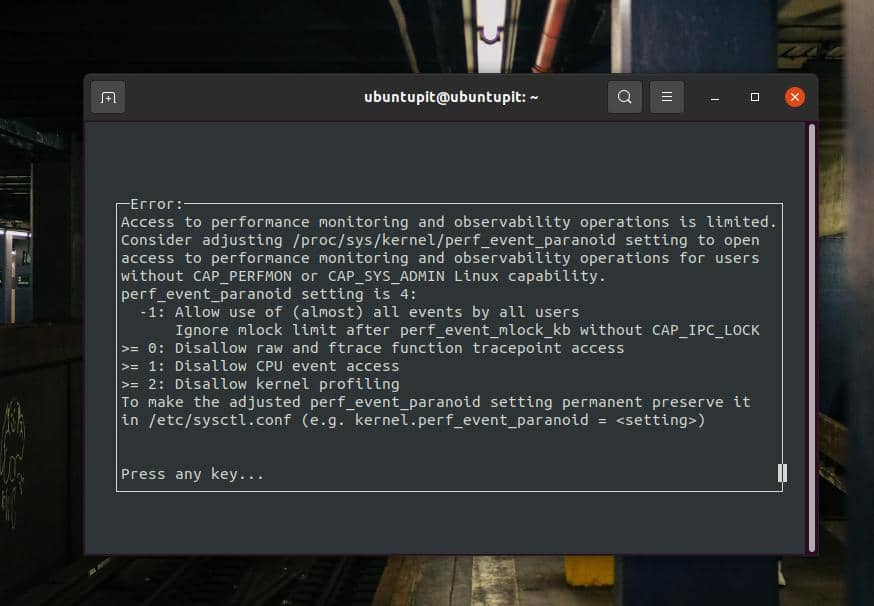
Here, I will show a few essential and day-to-day use Perf commands. All the commands require root privilege, and they are executable in all Linux distributions. If you see an Error message, as shown below, there is no reason to worry. You just need to return to the command shell and rerun the command with root privilege.
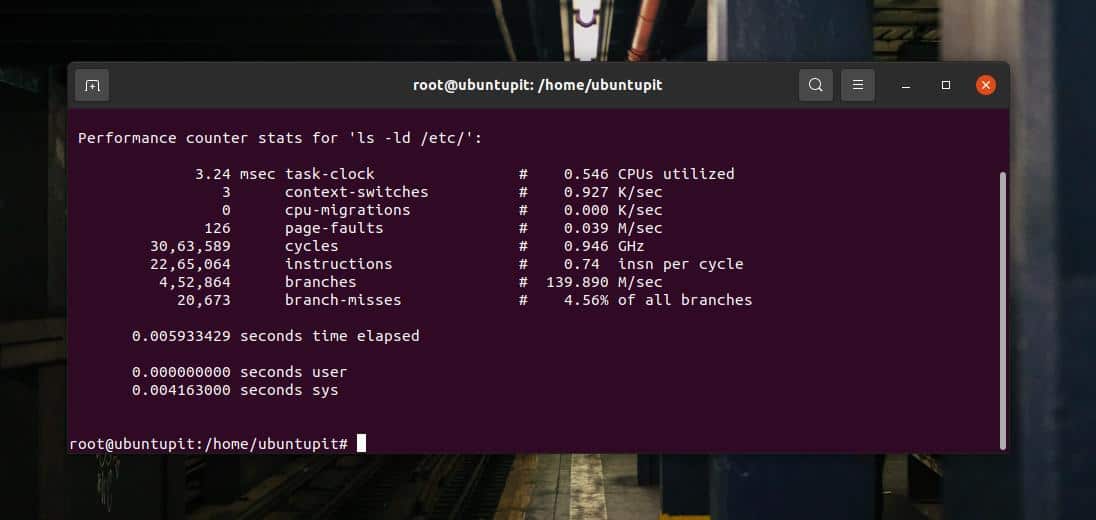
1. ls -ld
The ls -ld commands can print CPU utilization status, CPU cycles, and other CPU-related performance counter statistics.
perf stat ls -ld /etc/
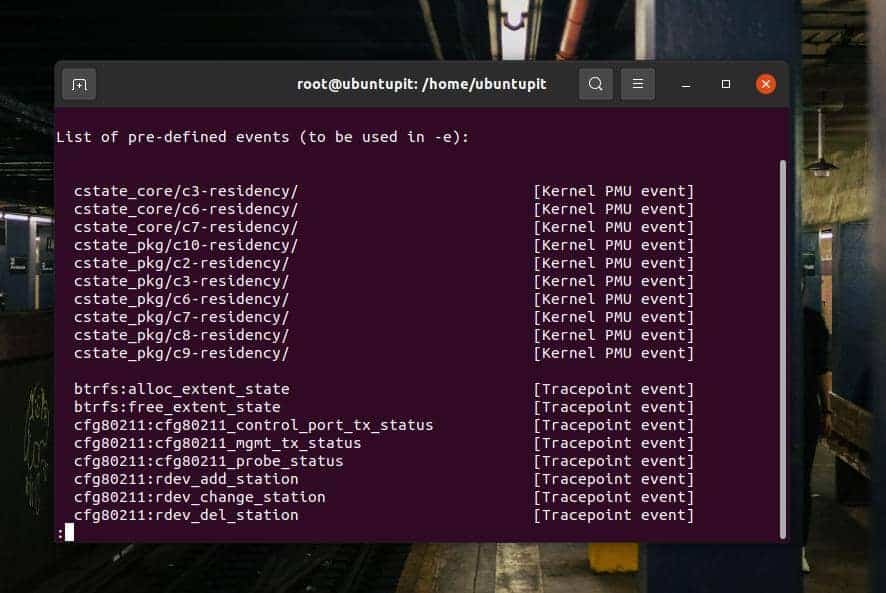
2. list
In Linux, the Perf tool can print all the kernel events through the list command. It can generate both detailed and statistical kernel events reports.
perf list
perf list stat
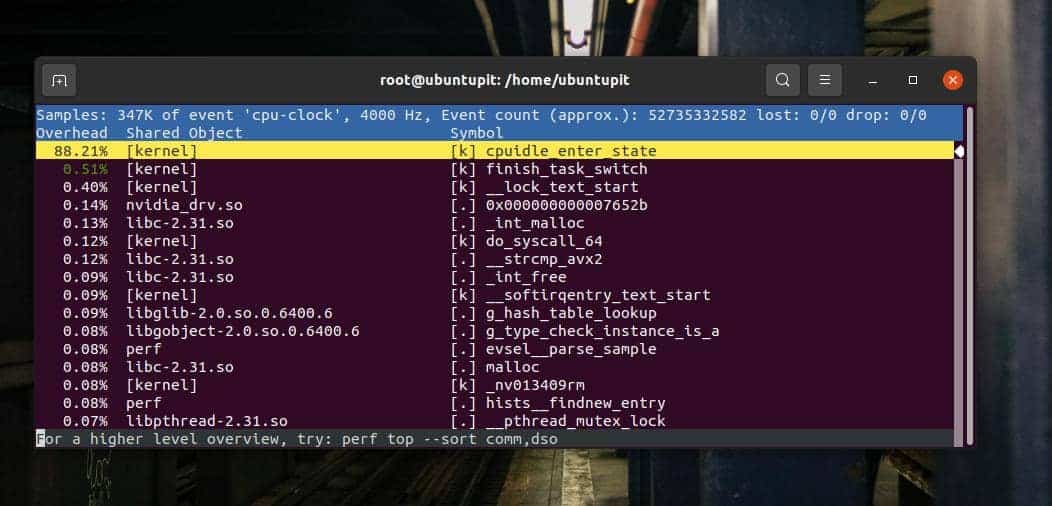
3. top
The following top command can print the CPU clock events and kernel events in a very accurate way. It also shows the kernel and CPU percentage of usages.
perf top -e cpu-clock
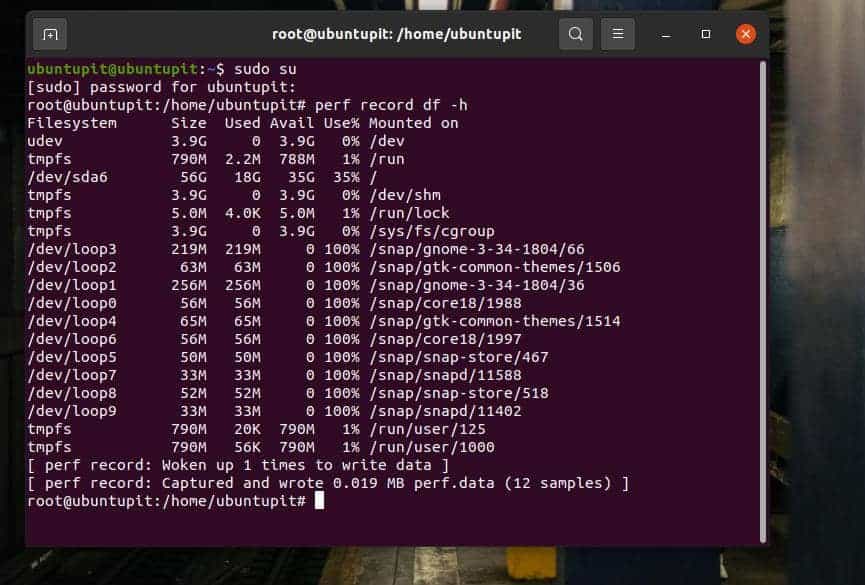
4. record
The following command will record the data of any Perf command that you want to store for future references.
perf record df -h
To view or display the recorded data, you can run the following report command on the shell.
perf report -i <perf file>
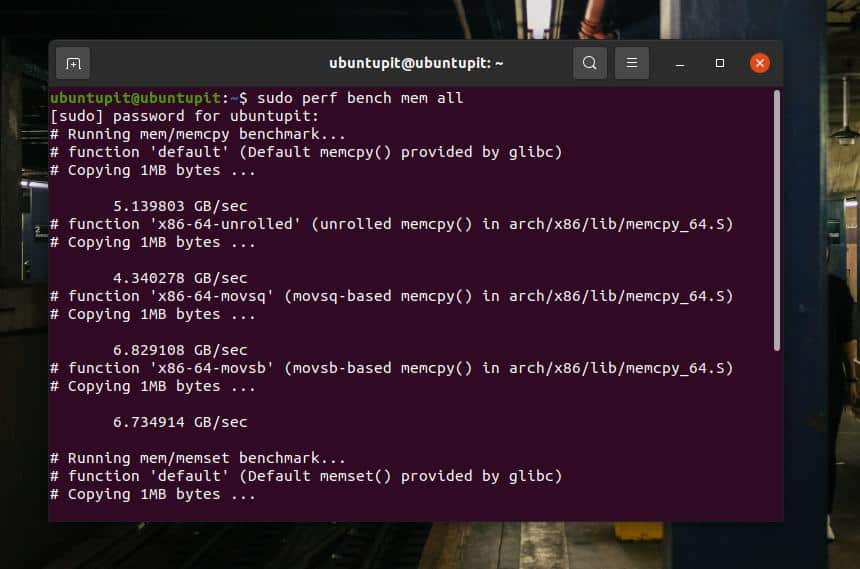
5. bench
To run a quick benchmark test for your system, you can run the following command to get benchmark reports about the system speed, CPU clock speed, and other parameters.
perf bench mem all
Extra Tip: If You Can’t Find Perf For Your Kernel
If you’re using a beta version of Kernel or a custom-build kernel on your Linux system, there is a chance that you might Perf for your system. In that case, you can either update your current kernel version to a stable version that has the capability to run Perf. You can check the list of kernels that are functional with Perf.
Final Words
Using the Perf tool on a Linux system can generate an elaborated list of CPU and kernel statistics. In the entire post, I’ve described the method of installing the Perf tool on Ubuntu and Red Hat-based Linux systems. Later, I’ve shown a few major Perf commands to get started with it.
Please share it with your friends and the Linux community if you find this post useful and informative. You let us know which version of the tools currently you’re using on your system to monitor the system statistics. Write your opinions regarding this post in the comment section.